A new accounting for Apollo: how much did it really cost?by Casey Dreier
|
| Somehow, the United States’ greatest triumph in human exploration—a triumph of engineering, cooperation, and organization—evades an answer to a seemingly simple question: how much did it cost? |
Though the convener is anonymous, you can feel their resignation in the written notes summarizing the meeting: “[it] had the predictable results… no one was fully prepared to discuss the problem… data extremely sketchy… discrepancies typically 15% - 20%.”
Such is the lament of the Apollo cost curious. Somehow, the United States’ greatest triumph in human exploration—a triumph of engineering, cooperation, and organization—evades an answer to a seemingly simple question: how much did it cost?
In early 1973 NASA provided written testimony[2] to Congress reporting the total cost of Apollo as $25.4 billion. The data provided summarizes, to one significant digit, major program lines, but does not express spending by year or by individual program. There are more detailed cost data[3] that claim Apollo only cost $19.4 billion—a significant discrepancy lacking obvious explanation.
How much was spent on Apollo, and when, is relevant as NASA has once again been directed to return humans to the Moon. With its goals to land humans in five years and then to establish a permanent human presence at the Moon, Project Artemis exceeds both the pace and ambitions of Apollo. To properly evaluate the seriousness of Artemis, then, it makes sense to compare its spending proposals to the one data point we have for a successful human lunar mission, Apollo. How much money did it take to do it the first time? How was it spent? And, perhaps most importantly, when did the money show up?
The participants of the meeting seemed to share this motivation for understanding the cost and phasing of Apollo, particularly as it applied to effective cost estimation and financial planning. So, despite the disappointing outcome of the meeting itself, it appears that the participants agreed to revisit original cost data in congressional budget narratives from the 1960s and to search the record collections at Johnson Space Center and Marshall Space Flight Center. Whether this actually happened, there is no indication.
Taking the lead from the anonymous notetaker in NASA’s financial office, I reconstructed Apollo’s entire reported cost history using publicly reported (but not readily available, until now) congressional budget narratives from fiscal year (FY) 1961 to 1974. I also visited NASA’s historical reference collection and discovered additional Apollo cost documentation prepared by NASA’s financial office, including a rare breakdown of annual construction and operations numbers. We can now attempt to answer “how much and when?” when talking about Apollo, and perhaps resolve some of the discrepancies noted above.
According to my reconstruction (Table 1), direct R&D obligations for Apollo were $20.6 billion between fiscal years 1960 and 1973. Adding “indirect” costs, such as the construction of facilities, operations, and deployment of the tracking and data network, results in a $25.8 billion total cost for Project Apollo. This agrees with the congressionally reported number within 1.6 percent and represents a significant improvement over the cost data presented elsewhere.
| FY | Apollo Total | Spacecraft | Saturn Launch Vehicles | Dev, Support, & Operations | Construction of Facilities | Facilities Operations and Overhead | Tracking and Data R&D |
|---|---|---|---|---|---|---|---|
| 1960 | $57,420 | $0 | $57,320 | $100 | $0 | $0 | $0 |
| 1961 | $299,228 | $0 | $174,531 | $297 | $53,400 | $71,000 | $0 |
| 1962 | $880,971 | $82,522 | $385,504 | $27,545 | $252,400 | $133,000 | $0 |
| 1963 | $2,001,035 | $363,962 | $757,976 | $136,497 | $560,600 | $182,000 | $0 |
| 1964 | $3,172,838 | $876,575 | $1,263,276 | $139,687 | $637,700 | $219,000 | $36,600 |
| 1965 | $3,197,219 | $1,009,898 | $1,434,179 | $170,542 | $215,100 | $268,000 | $99,500 |
| 1966 | $3,334,185 | $1,201,466 | $1,542,857 | $196,662 | $29,200 | $297,000 | $67,000 |
| 1967 | $3,375,300 | $1,275,001 | $1,373,580 | $274,019 | $44,700 | $316,000 | $92,000 |
| 1968 | $3,005,430 | $1,034,700 | $975,565 | $545,765 | $21,400 | $315,000 | $113,000 |
| 1969 | $2,454,000 | $913,127 | $577,986 | $533,887 | $0 | $302,000 | $127,000 |
| 1970 | $1,933,737 | $778,978 | $486,691 | $422,068 | $0 | $124,000 | $122,000 |
| 1971 | $1,112,169 | $398,147 | $189,059 | $314,963 | $0 | $104,000 | $106,000 |
| 1972 | $775,328 | $120,006 | $157,996 | $310,326 | $0 | $90,000 | $97,000 |
| 1973 | $180,000 | $56,700 | $26,300 | $0 | $0 | $41,000 | $56,000 |
| Totals | $25,778,860 | $8,111,082 | $9,402,820 | $3,072,358 | $1,814,500 | $2,462,000 | $916,100 |
Table 1. Direct (grey background) and indirect (white) annual costs for Apollo as reconstructed by the author. Source data.
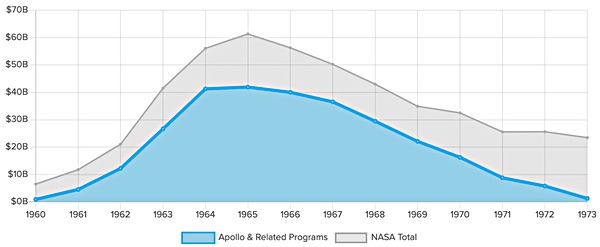 Figure 1. Project Apollo and related programs obligations per year, measured against total NASA obligations for fiscal years 1960—1973. All amounts adjusted for inflation to 2019 dollars using NASA’s New Start Index (NNSI). |
| To summarize: the entire lunar effort (with robotic missions and Gemini included) would cost $288 billion in today’s dollars. |
The small discrepancy is due to uncertainties in the reported costs of Saturn launch vehicles in the early 1960s. It’s possible NASA excluded initial Saturn development costs when submitting its report to Congress, as they precluded the start of Apollo. I elected to count it, however, as well as the DoD portion of the Saturn I obligations in FY 1960. I believe this decision helps to better answer the question of “what did the lunar landing cost?” as opposed to “what did NASA pay?” Overall, though, this data set agrees well with the values reported to Congress.
I include further program breakouts in the source data (Excel spreadsheet), which also preserves each fiscal year’s unique accounting profile as presented in their budget submissions. Since no accounting effort is wholly objective, I attempted to note every subjective decision I made in what to count, when, and where via per-cell comments in the Excel spreadsheet linked above.
Now that we have annual spending data for Apollo, we are in a better position to provide accurate adjustments for inflation, as inflation rates changed substantially year-to-year throughout the 1960s. I use two methods to adjust for inflation, both of which answer a slightly different question:
- NASA’s New Start Index (NNSI)[4] is explicitly designed to normalize the costs of aerospace projects over time by strongly weighting the changing costs of labor and aerospace materials. This adjustment answers the question, “How much would NASA be spending on Apollo today?”
- Spending as a relative share of the nation’s Gross Domestic Product (GDP). This adjustment answers, “If the US were to allocate resources to a space project to the same extent as it did for the lunar effort, how much would NASA be spending today?”[5]
| original $ | Adjusted 2019 $ | Relative GDP $ | |
|---|---|---|---|
| Spacecraft | 8.1 billion | 81.3 billion | 194.8 billion |
| Launch Vehicles | 9.4 billion | 99.0 billion | 243.4 billion |
| Development & Operations | 3.1 billion | 28.7 billion | 66.9 billion |
| Direct costs | 20.6 billion | 209.0 billion | 505.2 billion |
| Construction of Facilities, Salaries, & Overhead | 5.2 billion | 54.8 billion | 136.2 billion |
| Total Apollo | 25.8 billion | 263.8 billion | 641.4 billion |
| Robotic Lunar Program | 907.0 million | 10.3 billion | 26.1 billion |
| Project Gemini | 1.3 billion | 14.1 billion | 34.8 billion |
| Total Lunar Effort | 28.0 billion | 288.1 billion | 702.3 billion |
Table 2. Costs of the Apollo lunar effort, adjusted for inflation to 2019 dollars using the NNSI and relative GDP share. Detailed numbers available in the source data. Source data.
To summarize: the entire lunar effort (with robotic missions and Gemini included) would cost $288 billion in today’s dollars. If the US prioritized the project financially the same way it did in the 1960s, the nation would have to spend $702 billion to occupy the equivalent share of GDP.
What costs should we consider as part of Apollo?
Table 2 raises an important question: what do we include in the Apollo program?
Throughout the 1960s and 1970s, NASA’s budget was divided into three primary accounts: Research & Development (R&D), Construction of Facilities (CoF), and Administrative Operations (AO)—later renamed Research & Program Management (R&PM). Nearly all of the detailed cost data we have for Apollo comes from the R&D accounts, which paid for obvious things like the development and production of Apollo spacecraft, the Saturn V launch vehicle, mission operations, and project integration. I consider these to be “direct costs.” These data are why we frequently see the cost of Apollo reported as $20 billion.
“Indirect costs” should be included, however, as they were used to build Apollo’s enabling infrastructure at what are now known as Johnson Space Center, Kennedy Space Center, Michoud Assembly Facility, and Stennis Space Center. Without these facilities and their attendant staff, Apollo obviously would not have happened. These data are harder to suss out from congressional budget justifications, and I instead rely on two internal reports prepared for Congress from NASA’s financial office which breaks down facilities and overhead costs from FY 1961–1973[6,7].
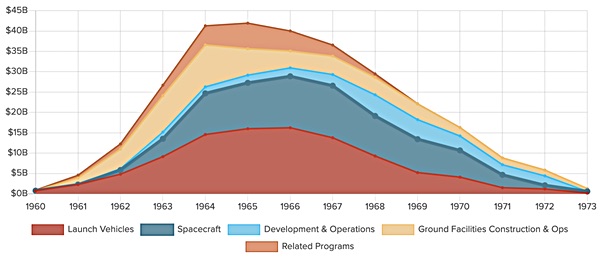 Figure 2. Cost of Project Apollo and related programs, by major sub-program, for fiscal years 1960 to 1973. All amounts adjusted for inflation to 2019 dollars using NASA’s New Start Index (NNSI). Source data. |
The sum of the direct and indirect costs results in the $25.8 billion number that closely matches the total cost supplied to Congress in 1973. However, I argue that this undercounts the total US investment in Apollo, as there were other efforts pursued in service of the lunar goal throughout the 1960s. In particular, Gemini refined operations and rendezvous in low Earth orbit in service of Apollo. The robotic lunar programs in the 1960s also mapped the lunar surface and provided crucial ground truth in advance of astronauts. Just because they weren’t included in the “Apollo account” in NASA’s ledgers doesn’t mean the money wasn’t spent. These are the two largest programs (together they were roughly $24 billion in today’s dollars) relevant to the lunar effort but rarely included in the total cost. I elect to include them as “related programs” and incorporate them into the total cost when speaking of the “lunar effort.”
Context for current human spaceflight programs and Artemis
NASA’s human exploration development efforts have remained quite stable over the past decade. Both the Orion crew capsule and the Space Launch System programs soldiered on despite the destination changes of asteroids, Mars, and the Moon.
With this new Apollo costing data, we can now better evaluate levels of spending between comparable programs in Apollo and today. Below I compare spending between the Saturn V and SLS and between the Command module and the Orion crew capsule. Why haven’t SLS or Orion flown yet after years of development? Well, the results speak for themselves:
 Figure 3. Comparing current major human spaceflight programs to similar programs during Apollo. The differences between funding are stark: current programs are subject to flat budgets while Apollo programs enjoyed significant upfront R&D investment. Apollo programs are normalized to 2019 dollars via NNSI and to the same start years as their modern counterparts. |
Adjusted for inflation and normalizing to the same development start dates as their modern counterparts, the Saturn V project cost NASA $60 billion by this point in its development, compared to $17.5 billion for the Space Launch System. Spending on Orion (assuming a generous start date of FY 2008) totals to $16.6 billion compared to $39 billion spent on the Command & Service Module by this point (though the CSM program had effectively ended by this point!) Compared to Apollo, the costs of NASA’s current human exploration projects are relatively paltry. That said, NASA’s overall budgets are themselves relatively paltry compared to the Apollo-era.
| While there are “new ways of doing business” in space today compared to the Apollo era, this new look at old data should remind us that crewed lunar exploration is costly and complex. |
Moving on to Project Artemis and its 2024 lunar landing goal, the most salient comparison is the lunar lander. NASA must develop, test, and fly a new lunar lander within the next five years. While the White House has not yet submitted a full budget run-out for this period, the supplemental budget request released in May of 2019 did propose $1 billion to begin lander development work in FY 2020.
As a comparison, during its first full fiscal year of development, the Apollo-era Lunar Module received $1.6 billion in adjusted dollars. Spending peaked three years later at $5.4 billion. The entire project cost (excluding the guidance and navigation computers) for the Lunar Module was approximately $23.4 billion in today’s dollars. If the White House is serious about landing on the Moon in 2024, we should expect significant growth in this project very soon.
While there are “new ways of doing business” in space today compared to the Apollo era, this new look at old data should remind us that crewed lunar exploration is costly and complex. The benefits of commercial entities in deep space exploration—though promising—are uncertain. I see few reasons to assume that commercial partners can provide greater capability for fractional amounts of the cost of past successful programs. We would do well to heed the words of Kennedy himself when considering Project Artemis. A lunar effort “is a heavy burden,” he said, “and there is no sense in agreeing or desiring that the United States take an affirmative position in outer space, unless we are prepared to do the work and bear the burdens to make it successful. If we are not, we should decide today and this year.”
Conclusions
Looking at old data in new ways provides helpful context for evaluating the seriousness of national space commitments. Comprehensive Apollo budgetary data allows us to compare not just the total program costs, but to see when the money showed up, how quickly budgets grew, and how it was divided up for each major program. Given the unyielding demands of orbital mechanics and astronaut safety, we can gain a better understanding of current human spaceflight commitments by making direct comparisons, program by program, to old data.
To replicate the successes of past lunar endeavors, we must understand that Apollo was not just a triumph of engineering, organization, and daring, but also as a triumph of political consensus that provided the money required to achieve the goal of landing a man on the Moon and returning him safely to the Earth.
An Addendum: why you shouldn’t use the “Apollo Program Budget Appropriations” data source
NASA History Office website hosts a detailed cost breakdown for Apollo, by year, compiled from The Apollo Spacecraft: A Chronology, volumes I through IV, published in 1978. Don’t use this. It contains numerous errors, significant omissions, and presents an inaccurate picture of Apollo funding.
First, the data presented as “Apollo Program Budget Appropriations” are not actually appropriations. Congress appropriates funds, NASA then programs those funds and eventually pays them out as expenditures. Planned spending is often different than actual spending, and expenditures generally lag behind contracted obligations, particularly in a project as challenging and dynamic as Apollo. NASA also benefited from “no-year” appropriations during the 1960s, allowing the agency to carry over unobligated funds year to year. The data listed in this table includes a mix of requested funds (FY 1962, FY 1973) and obligations (pretty much everything else 1960s), but not appropriations.
Second, there are significant omissions in funding for programs before 1964. The most glaring omissions are for the Saturn launch vehicles—note, for example, that this source lists $0 in funds for the Saturn I rocket before FY 1964, even though it first launched in 1961.
Third, it lists significant expenditures for orbital reentry tests, biomedical tests, and so forth in FY 1962. These numbers come from the FY 1962 budget request, and, as far as I can tell, were funds never actually obligated or spent. I believe these testing needs were eventually wrapped up into Project Gemini, which began after the FY 1962 budget estimates were prepared in early 1961. These are very likely phantom expenditures.
Fourth, the annual values for “NASA Total” only include the space agency’s R&D account. It excludes the Construction of Facilities and Administrative Overhead accounts and thus understates NASA’s annual budget.
Fifth, it incorrectly sums NASA’s total from 1960 to 1973 as $56 billion. This is wrong. It should be $41 billion. But what’s $15 billion between friends?
Sixth (and finally), it makes no attempt to normalize annual accounting changes. This is why there are columns with a single value for items like “Saturn I-C,” “Spacecraft,” and “Flight Modules (the CSM and LM). As these are presented without context, it is impossible to compare one year to another.
There are more reasons, but is it worth further belaboring a point?
Resources
“How much did the Apollo program cost?”
This page summarizes the costs of Apollo and includes beautiful charts highlighting the annual costs of major Apollo systems such as the Command and Service Module, the Lunar Module, and the Saturn V.
Project Apollo Cost Data Set (Excel spreadsheet)
Comprehensive Project Apollo annual cost data, non-inflation adjusted dollar amounts, program-by-program cost breakdowns, construction costs, and relative GDP adjustments are available to download as an Excel spreadsheet or to view as a Google spreadsheet.
NASA Budget Estimates & Documentation
A public Google Drive folder which includes NASA budget submissions to Congress, including between 1960 and 1973, as well as the additional Apollo budget documents mentioned here.
Endnotes
- Author unknown. “Apollo Cost Consensus Meeting Loose Agenda” June 22-23. No year provided. Budget Operations Division. Record Number 18194. Box 1. NASA HQ Historical Reference Collection. Washington, D.C. Given that the agenda is printed in a Microsoft Word font, it can’t be that old. It’s not unreasonable to speculate that this meeting was convened in advance of a NASA cost estimating symposium within the last decade.
- House Subcommittee on Manned Space Flight, 1974 NASA Authorization, Hearings on H.R. 4567, 93/2, Part 2, Page 1271. March/April 1973.
- Ertel, Ivan D. and Roland W. Newkirk. The Apollo Spacecraft - A Chronology: Volume 4. NASA SP-4009, 1978.
- This is a far better method than the Consumer Price Index. NASA does many things, but primarily purchase consumer products is does not.
- Alexander MacDonald demonstrated the utility of this method his excellent book, The Long Space Age: The Economic Origins of Space Exploration from Colonial America to the Cold War, Yale University Press. 2017.
- Author unknown. “Manned Lunar Landing Program. Code B official assessment.” Undated but likely 1969/1970. Budget Operations Division. Record Number 18194. Box 1. NASA HQ Historical Reference Collection. Washington, D.C.
- Author unknown. “Lunar Landing and Lunar Exploration Program Cost Summary.” Dated 2/27/1973. Budget Operations Division. Record Number 18194. Box 1. NASA HQ Historical Reference Collection. Washington, D.C.
Note: we are temporarily moderating all comments subcommitted to deal with a surge in spam.