Astroelectricity: America’s national energy security imperativeby Mike Snead
|

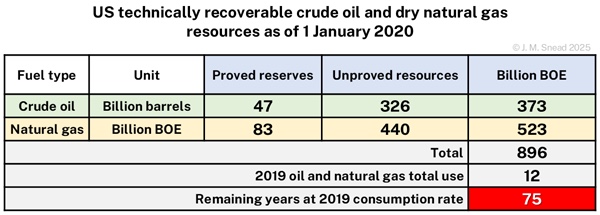 Figure 1: US technically recoverable crude oil and dry natural gas resources as of 1 January 2020. The energy unit “BOE” is an abbreviation for barrels of oil equivalent. References: US Energy Information Administration National Energy Modeling System’s Oil and Gas Supply Module, Tables 1 and 2, dated March 2022. |
Oil and natural gas now supply about 70% of the total energy used in America. Based on the pre-COVID-19 use of these two fuels—and prior to these recent trade deals—at the 2019 consumption rate of 12 billion BOE, the technically recoverable oil and natural gas resources would last about 75 years. Should US oil and natural gas exports be substantial and ongoing, then this lifetime estimate would obviously be shorter—perhaps, much shorter! Within the lifetime of today’s young children, these vital energy resources will likely be exhausted, leaving America dangerously energy insecure.
 Figure 2: The late-1973 oil embargo caused shortages of gasoline. To moderate demand, rationing was implemented in the form of odd and even number days, based on the number in the license plate, when gasoline could be bought. |
America has been down that dangerous road before. In 1970, after 111 years of generally steadily growing production, conventional US oil production peaked, making America oil insecure. Within three years, America’s first oil supply crisis hit when some Middle East nations attempted to squeeze the US president to align with their foreign policy priorities. That crisis dramatically increased oil prices and caused a substantial US recession.
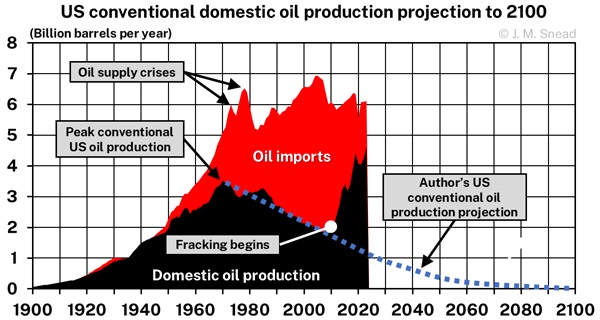 Figure 3: History of US domestic oil production and imports from 1900-2023 with the author’s illustration of the likely decline of conventional oil production through 2100. |
Within a decade, as America’s oil insecurity grew to the point that America was importing over half of the oil used, President Jimmy Carter declared protecting American access to foreign oil a national security priority. Within another decade, America was engaged in full-out conventional warfare in the Middle East to protect US access. It took nearly another 30 years for the US to finally be rescued —yes, rescued—from that quagmire by the practicable technological breakthrough of guided drilling and hydraulic fracturing known as “fracking.”
The US Department of Energy (DOE) was formed in 1977 by President Carter. He consolidated several existing federal agencies—many arising out of the Manhattan Project and civil nuclear power—into a department level organization focused on energy conservation and renewable energy sources, with a “side hustle” of managing much of the government’s nuclear weapon and nuclear power activities. (None of which have proven to reduce America’s persistent conventional oil insecurity.) Yet, buried deep in that organization when it was formed was federal research and development financial support for what became the fracking that rescued America three decades later and has now enabled the world to enter a period of energy insecurity dormancy led by the US.
The chart above shows the history of US domestic oil production. Specifically, the chart shows the sustained rise in production of conventional oil wells until the peak in 1970 followed by the decline that is still underway. This bell-shaped production curve is representative of all natural resources in demand. It was seen in the production of both wood fuel and coal in the US. Hence, we know that it will repeat with the production of fracked oil and natural gas.
As everyone should acknowledge, fracking is only a “band-aid” fix to America’s need to be permanently energy secure. Knowing this, it is only common sense that the US Department of Energy should have (by now) established a national energy security strategy to undertake America’s orderly transition to sustainable energy before, once again, America becomes energy insecure. However, this has not happened, even as the necessity for America undertaking this transition has been readily apparent for decades.
Responding to this need, I began to quantitatively model America’s energy use and evaluate its sustainable energy transition needs in 2008. Over the years, I have refined my analysis. In 2022, I summarized my findings in an article here in 2022. (See “Evaluating America’s green energy options including astroelectricity (part 1)”, The Space Review, November 14, 2022.) Recently, I updated and published my analytical assessment on ResearchGate. In this article, I summarize my updated results to reemphasize the point that pursuing the development of space solar power (SSP)-supplied astroelectricity should now be America’s (and DOE’s) national energy security imperative.
What will it take for America to “go clean”
The failed Green New Deal efforts make very clear that successfully transitioning to sustainable energy is not a trivial undertaking. Difficulties arise in two areas. First, the type of sustainable energy must be able to be scaled up sufficiently to make a difference. Second, the implementation of the solution must provide an orderly transition path while being practicable to be built. To better understand these two considerations, I will begin by explaining how much total energy America now needs and then show the equivalent amount of entirely sustainable energy needed for America to “go clean.”
America’s current energy use
The starting point is to refresh our understanding of pertinent energy units. For the use of primary combustible fuels in America —coal, oil, and natural gas—the primary energy unit is the British Thermal Unit (BTU). This unit originated two centuries ago to aid in designing steam engines. A BTU is the amount of thermal energy (heat) needed to raise one pound (16 fluid ounces) of water by one degree Fahrenheit. For perspective, when heating 16 fluid ounces of tap water to make tea, around 130 BTU of heat must be used. A BOE is defined as having 5.8 million BTUs of thermal energy.
For the following discussions, I use America’s energy use in 2019 as the baseline. That was the year prior to the COVID-19 pandemic when the impact of the pandemic and later national energy policy changes suppressed energy use. Thus, in terms of per-person energy use, the 2019 value indicates what is needed during generally prosperous economic times.
Reflecting the fact that fossil carbon fuels still predominate US energy use, America’s national energy use is often reported using a unit called the “Quad”. This is an abbreviation for 1 quadrillion BTUs or 1 × 10¹⁵ BTUs. The chart below shows America’s sources of energy and how energy use “flows” through the US economy. In 2019, according to this chart, America used 100.2 Quads of energy from all sources. Coal, petroleum (oil), and natural gas provided about 80 Quads or 80% of the primary energy, with just oil and natural gas providing nearly 70 Quads. Further, electricity use consumed about 37 Quads or 37% of the primary energy.
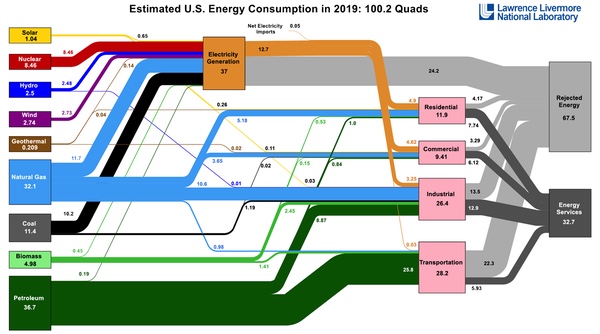 Figure 4: Diagram of how the sources of energy used in the US, shown on the left, “flow” through America’s economy to yield the goods and services consumed. Essentially, this entire energy flow needs to be made sustainable. |
One Quad equals 172.4 million BOE. Thus, from the above chart, the 100.2 Quads used in 2019 equaled 17.3 billion BOE, with the petroleum and natural gas consumption supplying nearly 12 billion BOE—the value shown in the earlier Figure 1 table.
An oil supertanker will carry two to three million barrels. Thus, in 2019, Americans used the equivalent of around 7,000 supertankers of oil—nearly one supertanker worth of energy every hour of every day. Of these, four of every five supertankers would be non-sustainable energy that must be replaced by new sustainable energy sources. Supplying 10–12 million BOE of new sustainable energy every day illustrates the challenge that America must solve to undertake an orderly transition to practicable sustainable energy. Clearly, this will require a well-developed “engineering” solution, not an impractical political solution as has been tried for the past several decades.
America’s possible sustainable energy source options
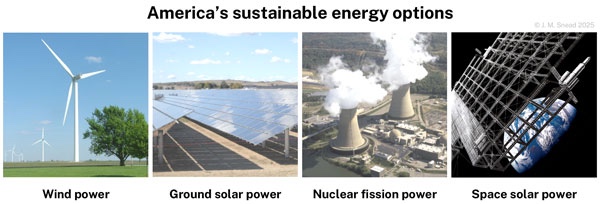 Figure 5: The four possible sustainable energy sources that are sufficiently scalable to substantially replace fossil carbon fuels. |
While there are many possible sources of terrestrial sustainable energy for America to use, biomass, hydroelectricity, geothermal electricity, and wave- and tidal-generated electrical power cannot be scaled up to become a primary source of sustainable energy to replace fossil carbon fuels. This leaves only wind power, ground solar power, and nuclear fission power as the remaining terrestrial options for America to possibly use to “go clean.” For this assessment, I added the option of SSP-supplied astroelectricity. Wind power and ground solar power are, obviously, intermittent power sources while nuclear fission power and astroelectricity are baseload power sources, meaning that they are assumed in this assessment to be able to operate continuously.
American current per person use of energy
The starting point to determine how much sustainable electrical energy America will need to go clean is to start with America’s current average energy use per person—specifically per resident. Using updated consumption and population values for 2019, the following chart shows how much energy per person was used on average and how this was consumed in the form of electrical energy and fuels.
In 2019, 12,545.8 kilowatt-hours (kWh) of electrical energy and 31.1 BOE of fuels were used per person on average. In total, the equivalent of 50.584 BOE of energy was used per person. (By using the BOE unit, this provides an appreciation of how much energy is actually being used per person in America today.)
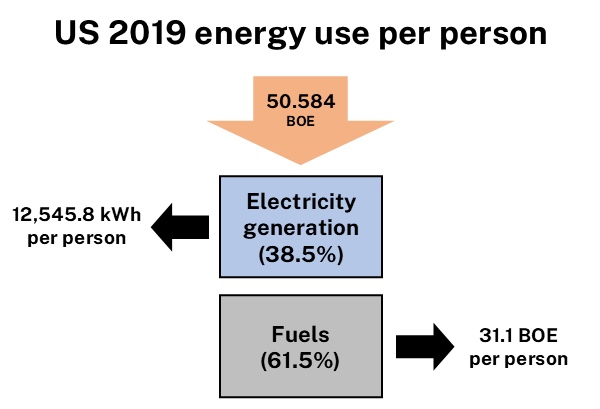 Figure 6: US average total energy used per person in 2019 showing the breakdown into electrical energy and fuels use. |
Introducing two new energy units
In America’s new sustainable energy infrastructure, electrical energy will be the primary type of sustainable energy used. The two electrical energy units used that will replace the BTU and BOE are the kilowatt-hour (kWh) and the gigawatt-hour (GWh). However, with kWh and GWh not having any real world physical meaning—as the BTU and BOE do—two new energy units are needed to help appreciate how much sustainable electrical energy will be needed per person and nationally.
From the above chart, 12,545.8 kWh of electrical energy was used on average per person in 2019. This was the electricity used directly (e.g., air conditioning) as well as that used to produce the goods and services consumed. There are 8,760 hours in a year. Thus, 12,545.8 kWh ÷ 8,760 hours = 1.43 kW of electrical power being used continuously throughout the year, on average. We can conveniently express 12,545.8 kWh as 1.43 kW-continuous or 1.43 kWc.
A typical microwave oven uses 1 kW of power when operating. Thus, in 2019, each American consumed enough electricity to operate 1.43 microwave ovens continuously. We can think of the per person electrical energy use in terms of microwave ovens just as we thought of the total energy use in terms of the barrel of oil equivalent.
In 2019, the US used 4,130,574 GWh of total electrical energy, or 472 GW continuous, GWc. The Hoover Dam can generate 2 GW when operating at full power. If the Hoover Dam could operate continuously, it would be rated at 2 GWc. We can use this to express the 472 GWc generated in 2019 as being equivalent to 236 Hoover Dams operating continuously.
When mentioning that the US was generating the equivalent of 472 GW of continuous power, most people would have little appreciation of how much energy that was. However, if this is stated as the US was producing the equivalent of 236 Hoover Dams operating continuously, this can readily be understood. Just as I will use the number of microwave ovens operating continuously to illustrate how much clean energy will be needed per person, the number of Hoover Dams operating continuously will be used to illustrate how much total sustainable energy for America will need to go clean.
 Figure 7: A microwave oven and the Hoover Dam are used to provide a perspective on how much sustainable energy America will need per person and nationally to “go clean”. |
(Note: Before continuing, take a guess at how many Hoover Dams operating continuously would be needed for America to fully transition to sustainable energy.)
Modeling America’s needed new sustainable energy infrastructure
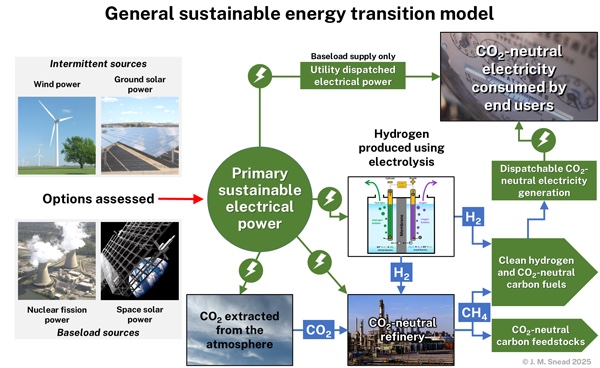 Figure 8: Diagram of the model used to estimate the total primary sustainable electrical power (kWc) needed to go clean. |
The sustainable energy transition model I used is shown in the diagram above. The complexity of energy use in America—as shown earlier in the energy flow diagram—and the need for carbon-based fuels and industrial feedstocks makes an all-electric or an electric-hydrogen energy infrastructure impracticable to use. Therefore, in this model, both clean hydrogen and CO₂-neutral (clean) carbon fuels are supplied to replace the use of fossil carbon fuels. By producing clean carbon fuels and industrial feedstocks, the transition from the use of fossil carbon fuels to an entirely sustainable energy infrastructure is seamless, making it generally transparent to the end-users. This is what I call an “orderly” transition.
(Note: All carbon used to produce synthetic carbon fuels and industrial feedstocks comes from the CO₂ either extracted from the atmosphere or captured in the exhaust of industrial plants, power plants, and waste disposal incinerators. In this manner, no net CO₂ is added to the atmosphere. This is necessary for undertaking an orderly transition to sustainable energy.)
I used this model to estimate the total primary sustainable electrical power (kWc) needed per person to supply 12,545.8 kWh of sustainable dispatched electrical power and 31.1 BOE of sustainable fuels. This model was run separately using only intermittent primary power and then using only baseload power.
(Note: For this top-level estimate of sustainable energy needs, only synthetic methane is assumed to be produced to supply the needed replacement fuels.)
America’s total kWc and GWc needed to have already “gone clean” in 2019
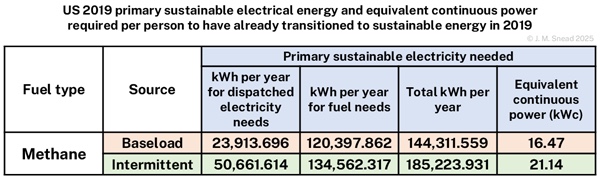 Figure 9: Estimated total kWh of primary electrical energy and kWc of primary electrical power needed per person on average in the US in 2019 to have already transitioned to sustainable energy. |
Recall that in 2019, the average end-user, directly and indirectly, used 1.43 kWc of utility-dispatched electrical power. This was generated using 38.5% of the total energy used. If all energy consumed had been used to generate electricity, then the total would have been 3.71 kWc.
From the above table, to transition fully to sustainable energy using the baseload-methane case, 16.47 kWc would be needed per person. Thus, for the baseload-methane case, America’s new sustainable energy infrastructure needs to supply roughly 4.4 times more energy per person. When using intermittent sources, this increases to 21.14 kWc, 5.7 times more energy. Using the microwave oven metaphor, the energy need increases from about 4 microwave ovens to about 16 for the baseload case and about 21 for the intermittent case. Hopefully, this is making clear the magnitude of the challenge of America successfully transitioning from fossil carbon fuels.
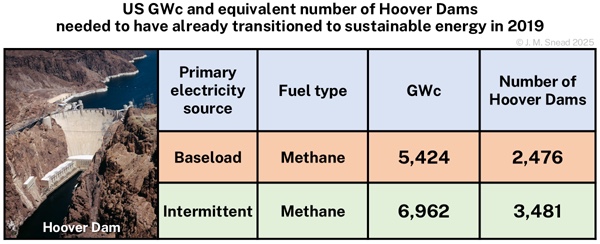 Figure 10: Comparison of the total GWc of primary electrical power needed in 2019 along with the equivalent number of Hoover Dams operating continuously to supply that power. |
The total GWc needed for America to have already transitioned to sustainable energy can easily be calculated by multiplying the above table’s kWc values by the US 2019 resident population. These results, along with the equivalent number of Hoover Dams operating continuously, are shown in the table above. When using baseload primary power, the equivalent of 2,476 two-gigawatt Hoover Dams operating continuously, supplying 5,424 GWc of electrical power, would have been needed. For the intermittent case, this increases to the equivalent of 3,481 Hoover Dams supplying 6,962 GWc.
Was your guess anywhere near this number?
(Note: The 2019 resident population used was about 329 million. Each additional million adds the need for 7.5 additional Hoover Dams operating continuously.)
Assessing America’s four possible scalable sustainable power options
As noted earlier, America has only four possible sufficiently scalable options to enable its transition to sustainable energy. The intermittent options are wind power and ground solar power, while the baseload options are nuclear fission power and space solar power-supplied astroelectricity. In my assessment, I examined each to determine if it was a practicable solution at the scale needed to fully meet the GWc need.
Wind power
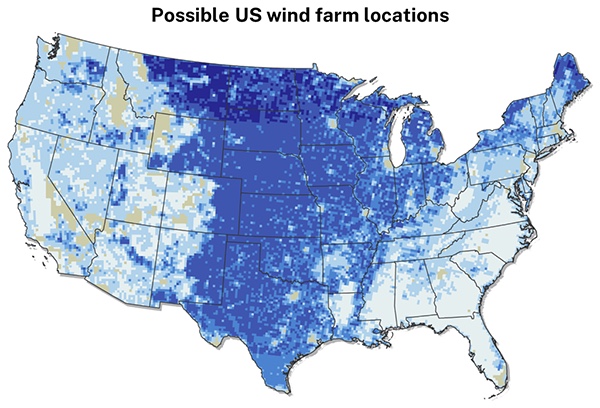 Figure 11: Possible wind farm locations in the contiguous US for wind turbines with a hub height of 110 meters. |
The above map was created by the US National Renewable Energy Laboratory (NREL) as part of their assessment of the wind power potential in the contiguous US. The blue areas are where commercial wind farms could be built with the darker blue areas where the annual wind energy potential is greatest.
The NREL study found that about five million square kilometers (1.9 million square miles) of the contiguous United States could be used to build commercial wind farms. Building out this extent of wind power would require installing about 7.7 million wind turbines on nearly two-thirds of the contiguous US.
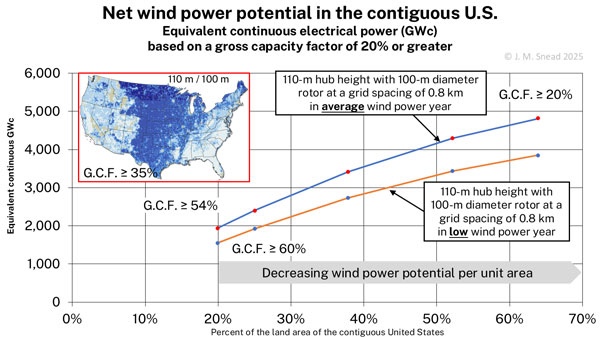 Figure 12: This chart summarizes the author’s analysis of the NREL assessment of the wind power potential in the contiguous US. It shows how the total GWc available increases as more of the land area is used for wind farms, beginning with those areas with the greatest wind power potential. |
From my assessment’s results—shown in the chart above—such extensive use of commercial wind farms could yield 4,756 GWc of intermittent primary electrical power in an average wind power year. Recall that 6,692 GWc of such intermittent primary power would have been needed in 2019. Thus, in an average year, the available wind power is only 68% of what the US would have needed to transition fully to sustainable energy. In a low wind power year, this drops to 3,805 GWc, or only 55% of what would have been needed. Obviously, wind power alone is not a practicable solution since the American public is unlikely to accept covering America with a forest of wind turbines, especially without yielding a full sustainable energy solution.
Ground solar power
While obviously there is sufficient land in the contiguous United States on which to build ground solar farms, how much land would be needed? By my estimate, to supply 6,692 GWc of intermittent primary power, about 14% of the contiguous United States would need to be converted into ground solar farms. In total, the required land area, within the perimeter fence, would be 1.1 million square kilometers (420,000 square miles). As shown in the map below, this is equivalent to a square of land 1,045 kilometers on each side.
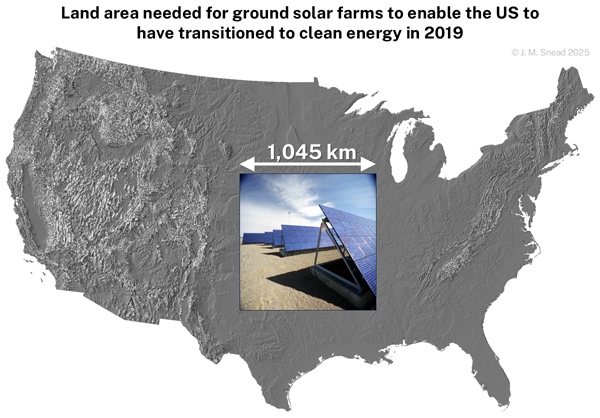 Figure 13: Representative total area of ground solar farms needed to meet the US 2019 GWc need overlaid on a terrain map of the contiguous US. |
As the map above shows, a large percentage of the contiguous United States is unsuitable for ground solar farms due to terrain, especially in the sunny Southwest. Also, suitable locations for commercial solar farms require generally flat land and a location that has generally sunny skies—essentially the same requirements needed for large-scale agriculture. Thus, while needing only 14% of the total contiguous land area may not at first appear unreasonable, ground solar farms would need to be built across much of America’s breadbasket states. This is unlikely to be politically acceptable as well as being unacceptable from a food-security perspective.
Hence, as with wind power, ground solar power alone is NOT a practicable means of enabling America to transition to sustainable energy. In fact, a combination of wind power and ground solar power is also not a practicable solution as it still requires a coast-to-coast forest of turbines while only cutting the required land area for solar farms in half.
Nuclear fission power
With wind and ground solar power not enabling America to undertake a practicable transition to sustainable energy, the only remaining terrestrial option is nuclear fission power. As noted previously, the baseload-methane case would require 5,424 GWc of primary electrical power. This equates to 5,641 GW of nameplate power with the assumption that each plant would not be generating power for two weeks each year to undertake maintenance, inspection, and refueling. For perspective, the US currently has around 100 GW of nuclear power generation capacity. To fully meet the baseload sustainable energy need using only nuclear fission power, about 56 times more nuclear generation capacity would be needed.
As has been recognized since the 1950s, with natural uranium only having 0.72% of the U-235 fissile fuel needed by the reactors, breeding is needed to undertake a substantial expansion of nuclear fission power. It is estimated that about 1.2 metric tonnes of fissile fuel are needed per GW-year of generation. Thus, to fully meet the US sustainable energy need, 6,509 metric tonnes of either Pu-239 or U-233 would need to be bred each year. For perspective, from 1945 until it ended breeding in 1987, the government’s Hanford plant only produced a total of 67.4 metric tonnes of plutonium for use in nuclear weapons and to power naval reactors.
While nuclear breeding reactors were pursued in the 1960s and early 1970s, by the end of the 1970s, these were abandoned due to worries about nuclear weapon proliferation as both Pu-239 and U-233 can be used to produce nuclear weapons. Further, no enrichment is needed as with U-235. Thus, nuclear breeder reactors could covertly—or defiantly, by a rogue nation—be used to produce fissile materials to make nuclear weapons. Should the United States establish a precedent for using nuclear breeder reactors to transition to sustainable energy, this will most certainly open the door for uncontrollable nuclear weapon proliferation worldwide.
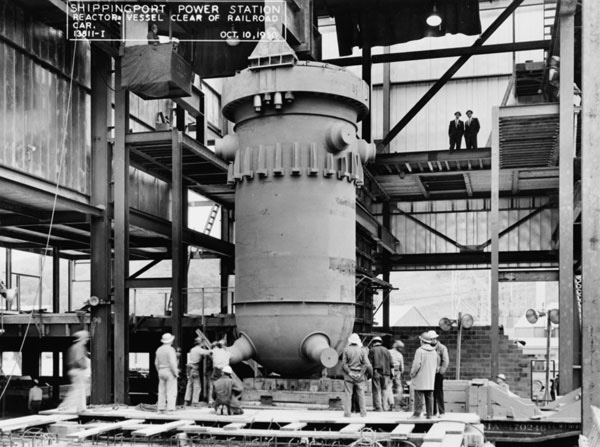 Figure 14: An already built naval reactor was used to speed up the construction of the Shippingport Atomic Power Plant. |
In the 1950s, the US advocated for the peaceful use of nuclear energy. The first civilian nuclear power plant was built at Shippingport, Pennsylvania. An unneeded US Navy 60-megawatt (MW) reactor, developed for an aircraft carrier, was installed in 1956 as shown in the photograph above. The plant began to generate electrical power the next year.
This particular reactor bred fuel while producing power. During its 25 years of operation, it first bred Pu-239 and, later, was modified to breed U-233. However, doing this required a special core of weapons-grade U-235 to breed Pu-239 with a similar approach used to breed U-233. This effort spurred interest in the 1960s and early 1970s in developing more advanced breeding power reactors—efforts that were abandoned by the end of the 1970s.
The Shippingport Atomic Power Plant illustrates why there is current interest in building new nuclear fission power plants using smaller “modular” reactors. The intent is to reduce the construction cost and shorten the plant’s construction time by powering it with one or more smaller reactors that can be built on an assembly line and then installed in the plant as was done with the naval reactor. To achieve the US total GWc need, the chart below shows how many of such small modular reactors in the range of 100–500 megawatts would be needed.
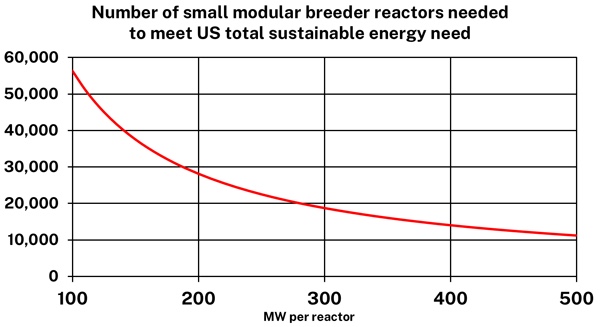 Figure 15: Number of small modular reactors needed to meet the US 2019 GWc need as a function of the reactor nameplate power generation rating. |
Naval reactors typically have an operating life of about 30 years. Thus, the small modular reactors will have a finite life perhaps in the range of 30 to 60 years. At the end of their life—when the reactor would likely be highly radioactive—each would need to be decommissioned, removed from the power plant, and transported to where they would be finally (somehow) rendered no longer a radioactive hazard to humanity.
While this sounds straightforward, when the Shippingport reactor was decommissioned and removed in the late 1980s, to render it safe for transport, the reactor pressure vessel and its steel and concrete filled surrounding radiation shield weighed 870 metric tonnes. It required a 320-wheel trailer to transport it the short distance to the Ohio River to be loaded aboard a special oceangoing barge for transport down the Ohio and Mississippi Rivers and then by sea to Washington state where it was entombed—meaning it is probably still there. This is what may need to be done to remove and replace the modular reactors—perhaps several hundred each year—at the end of their rated life to keep the nuclear power plants operating.
In addition to the nuclear weapon proliferation issues and the likely need for the transport and entombment of highly radioactive decommissioned reactors, many other serious concerns exist. Among these are the threat of natural disaster (such as the tsunamis that destroyed several Japanese nuclear power plants in 2011), a continuously expanding need for nuclear waste disposal (with no current politically acceptable solution), the growing threat of terrorist attacks (perhaps using drone-deployed weapons), and the threat of a space-based electromagnetic pulse attack (potentially rendering the reactors’ safety systems inoperative). As with wind power and ground solar power, nuclear fission power will not enable America to undertake an orderly transition to sustainable energy.
Astroelectricity
As the 1960s came to an end, American oil insecurity was emerging as a major political, economic, and national security issue. One proposed solution—far ahead of its time—was to collect sunlight in Earth orbit, convert this into electrical power, transmit this power via radio waves to special receiving antenna (rectenna) farms on the ground, and supply this power—what I call “astroelectricity”—to the power grid as baseload power. This is called space solar power (SSP). It was invented by Peter Glaser in 1968, perhaps building on the idea of beaming power to planets in a 1941 story by science fiction author Isaac Asimov. Glaser received a US patent for this in 1973.
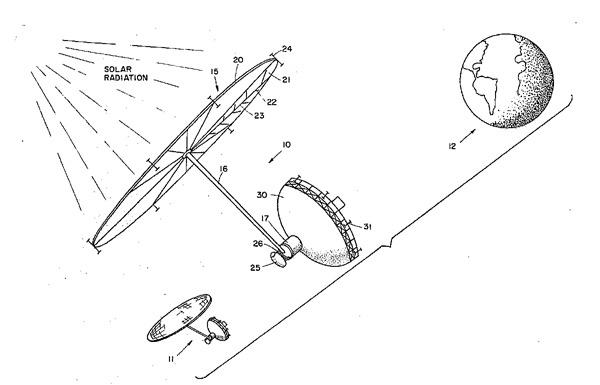 Figure 16: Illustration of space solar power from Peter Glaser’s space solar power patent. |
As America’s energy insecurity grew in the 1970s—and after breeder reactors were abandoned—space solar power was investigated from 1978 to 1980 by NASA and the recently formed DOE. From these efforts, a baseline five-gigawatt space solar power system was defined. This concept is shown in the following illustration. It involves using Manhattan Island-size space solar power platforms located in geostationary Earth orbit (GEO) to collect sunlight, convert this into electrical power, and transmit the power using radio waves to the ground receiving antennas (rectenna farm).
 Figure 17: Illustration of the ground rectenna site that would receive the power transmitted from the space solar power platform. The transmitted power will be converted into “astroelectricity” and fed into the regional power grid just as is done with baseload powerplants today. |
I refer to the ground rectenna farm as an astroelectric plant. For the baseline 5-GWc design, the ground area used by the astroelectric plant is shown in the following illustration. For a typical plant located in the contiguous US, the plant’s rectangular area would be 12.6 km 16.6 km = 209 square kilometers (81 square miles). This equates to 42 square kilometers (16 square miles) needed per 1 GWc of baseload power supplied.
(Note: The GEO SSP platforms will enter the Earth’s shadow at local midnight for about an hour each day for about a week before and after the spring and fall equinoxes. This would be at a time of minimal power demand—seasonally as well as daily. With the annual loss of energy being less than 1%, for this top-level assessment, the SSP platforms are considered to be operating continuously.)
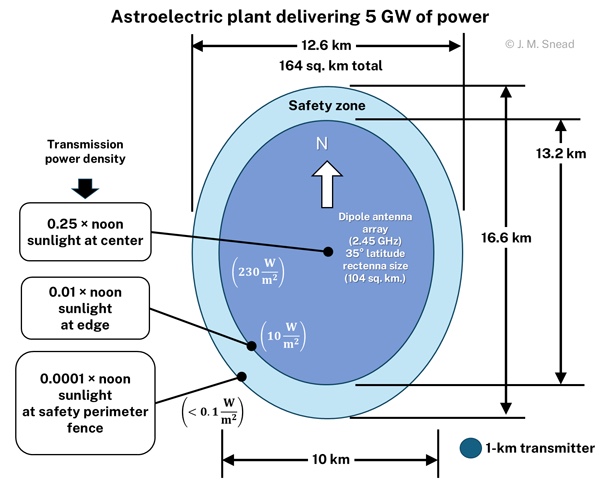 Figure 18: Diagram of the dimensions of a typical astroelectric plant located in the mid-latitudes of the contiguous US. |
I assumed that astroelectricity would supply 80% of the primary baseload power America would need. This equates to 4,339 GWc of astroelectricity needed. This would require about 182,000 square kilometers (70,000 square miles) of land in the contiguous United States for the astroelectric plants. This is less than 3% of the contiguous US. For perspective, this is comparable to the total land used for cities in the contiguous US.
For the remaining 20% of the total GWc needed, ground photovoltaic solar farms would be used. Using special rectenna panels collecting both sunlight and the transmitted power, these solar farms would be built as part of the overall astroelectric plants.
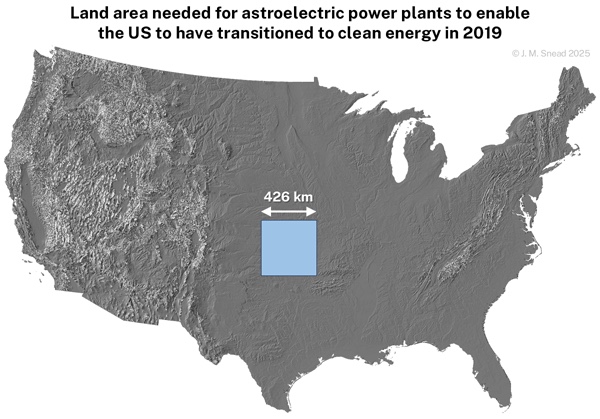 Figure 19: Representative total area of astroelectric plants needed to meet the US 2019 GWc need overlaid on a terrain map of the contiguous US. |
The approximate total land area needed for this astroelectric option is shown on the map above. The 180,000 square kilometers needed for the astroelectricity option compares very favorably to the more than one million square kilometers needed for an all-ground solar power solution or with the coast-to-coast forest of wind turbines and a half-million square kilometers of ground solar farms needed for a combined solution. The space solar power option will provide America with the best form of sustainable primary power—baseload—while minimizing the land area needed to meet America’s total sustainable energy need. Also, it is the only one of the four options that provides a practicable solution for undertaking an orderly transition to sustainable energy.
Conclusion
The primary conclusions drawn from the assessment are:
- At least for America, only SSP-supplied astroelectricity can provide an orderly transition to sustainable energy at the scale needed to replace fossil carbon fuels.
- The magnitude of America’s transition to sustainable energy is immense requiring concerted leadership and effort by the Government to ensure that it is effectively undertaken.
- To avoid a return to the geopolitical plague of energy insecurity, America must complete the transition to SSP-supplied astroelectricity before the end of this century while being ready to begin its orderly deployment by the time fracked oil and natural gas production peaks and begin their inevitable decline.
Acknowledging today’s moral obligation that we owe to future generations to ensure that their America will still be free, prosperous, energy secure, and at peace, undertaking SSP must now become America’s national energy security imperative.
Note: we are now moderating comments. There will be a delay in posting comments and no guarantee that all submitted comments will be posted.