Costs of US piloted programsby Claude Lafleur
|
| The US has spent $486 billion over 57 years on human spaceflight, an average of $8.3 billion a year. |
Almost nobody knows because these figures are difficult to calculate. First, we need to find how much NASA spent each year on these programs, and then add these dollars taking into account inflation. We couldn’t add 1970s dollars to 2000s dollars. For example, if we simply added Apollo programs fiscal spending during its fifteen-year existence, we obtain $20.4 billion. That’s the usual program cost reported. However, doing the same math using constant 1975 dollars give $29.3 billion. And using 2010 dollars give us $109 billion. We thus could say that the Apollo program cost $20 billion in then-year dollars, $30 billion in 1970s dollars, or $110 billion in today’s money.
How does this compare to the Space Shuttle and ISS programs? In this essay, I’ve calculated the costs of US piloted programs and then make some comparisons. (All the numbers used for this essay and their sources are available at the “U.S. Piloted Programs Costs” page.)
Doing spaceflights in the 1960s and 1970s
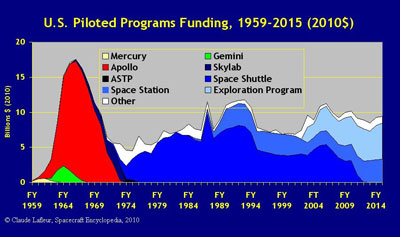
Before Apollo, there were the Mercury and Gemini programs. Project Mercury spanned five years (1959–1963) and cost $277 million in 1965 dollars, which translate into $1.6 billion in 2010 dollars. Since six Mercury piloted missions were flown, that amounted to $265 million per flight in today’s money.
As for Gemini, the program costs $1.3 billion in 1967 dollars during its six-year lifespan (1962–1967). In today’s money, it would amount to $7.3 billion, or $723 millions for each of its 10 piloted missions. We thus could say that a Gemini mission cost twice as much as a Mercury’s.
As reported above, the Apollo program costs $20.4 billion if we simply added yearly spending of its 15 year-lifespan (1959–1973), or $109 billion in today’s money. Since 11 Apollo piloted missions were flown, that amounts to $9.9 billion per flight. That’s way over Mercury and Gemini mission costs, reflecting the complexity of going to the Moon. And if we consider these $109 billion resulted in six lunar landings, each of these missions costs some $18 billion!
After Apollo, there was the Skylab space station program, which cost $2.2 billion in then-year money ($10 billion in 2010 dollars) during its nine-year existence (1966–1974). Considering that three three-men crews spent a total of 510 person-days onboard Skylab, this mean that each day spent by a crewman costs $5.5 million. (We’ll compare this to living onboard ISS.)
Finally, the first era of the US piloted program ended in 1975 with the Apollo-Soyuz Test Project. The American portion of this US-Soviet mission costs $245 million at the time, or $1 billion in today’s dollars.
The Space Shuttle and Space Station era
The longest and most complex piloted program so far is the Space Shuttle. Started in 1972, it will end by 2012 after 41 years. Adding annual funding over such a long period would total $123 billion. However, the true cost of the Shuttle is $198.6 billion in 2010 dollars. Considering that 134 Shuttle missions are scheduled, it means that each one costs about $1.4 billion.
As for the International Space Station, the program began in 1985 and will extend at least until 2015. For this thirty-year span, some $58.7 billion were budgeted by NASA. This amounts to $72.4 billion in today’s money.
| Each day spent onboard by an ISS crewmember costs about $7.5 million, compared to $5.5 million for Skylab. |
However, this amount does not include 36 Shuttle flights needed to build the station, nor the contribution from the international partners. Adding 36 flights at $1.4 billion each would incur an additional $54 billion. And if we include the international partners’ contributions (Russia $12 billion, Europe and Japan $5 billion each, and Canada $2 billion) the total ISS program cost is about $150 billion (up until 2015).
ISS has been crewed since November 2000 by two- to six-person teams. From then on to 2015, we could estimate that the station will be manned by some 20,000 person-days. Considering its $150-billion price tag, that would mean that each day spent onboard by an ISS crewmember costs about $7.5 million (compared to $5.5 million for Skylab.)
All the funds allocated to NASA for piloted programs from 1959 to 2015 adds up to $275 billions in then-year dollars, or $486 billion in 2010 dollars.
In this review of all major US piloted programs, there is another one that is less known but for which funding is as high as those allocated to the Space Station: the Exploration program.
Tens of billions… and counting!
In January 2004, President George W. Bush announced that the Space Shuttle program would end by 2010 and unveiled a new goal for the United States: to go back to the Moon in 2020 and then continue to Mars. Bush said his Vision for Space Exploration (VSE) would pay for itself by funding reductions from other programs (mainly the Shuttle) and by the expected normal increase in NASA annual budget.
Unfortunately, Bush’s VSE was not funded properly, and last month President Obama announced its cancellation. What happened between 2004 and today?
On the day President Bush announced its plan, NASA published a graph showing the SEI funding strategy:
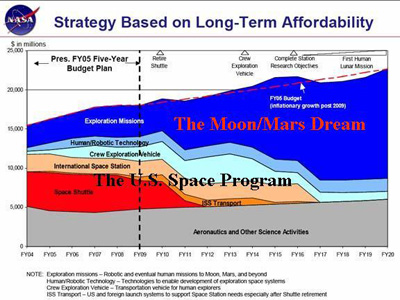 |
According to this graph, which covers the years 2004 to 2020, NASA’s “Aeronautics and Other Sciences Activities” (in gray) will be funded at about $5 billion a year. The Space Shuttle funding (red) will decrease from $5 to $4 billion a year until 2010, and all funding will end in 2012. As for the International Space Station (salmon), it will be funded at about $2 billionsa year. Accordingly, the Moon/Mars Exploration program (blue) will be funded from $4 to $5 billion in its early years, increasing to $10 billion a year at the end of the 2010s.
Since President Bush was re-elected in 2004, how did his Administration budget the first six years of the Vision for Space Exploration? What was the true funding?
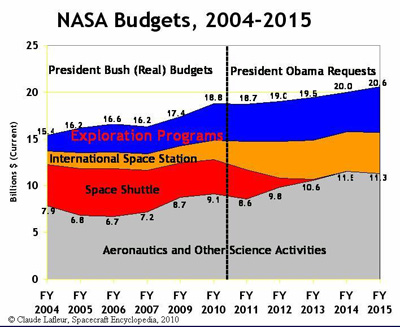 |
This second graph shows the amount allocated to NASA by the Bush Administration from 2004 to 2010 and the Obama requests for 2011 to 2015.
It first shows that NASA’s total budget was at the level planned in 2004 by the Bush Administration. NASA had not suffered any deep cuts (as sometime reported). As indicated in both graphs, its budgets started at $15 billion in 2004 and are projected to grow to over $20 billion by 2015.
However, the funding budgeted for the Exploration program was well under what had been planned. From the start, the Bush Administration budgeted less than half of what it had shown in his graph. And since the Space Shuttle and the Space Station programs were funded at planned levels, the additional funding NASA received during this period were allocated to the Aeronautics and Other Sciences Activities portion of its budget. The same could be said about the Obama Administration.
So, instead of a flat $5-billion-a-year funding planned, the Aeronautics and Other Science Activities started at $8 billion in 2004, growing to $9 billion in 2010 and is scheduled to top $11 billion by 2015. As for the Exploration Programs (which included the Constellation lunar program), it started at only $1.6 billion in 2004 (half of what the Bush graph shows) to grew to $4 billion in 2010. And, although President Obama announced its cancellation, this program will continue to be funded at the $4-billion level until at least 2015. This $4-billion-a-year funding is as high of what it is planned for ISS!
For what purpose will this $20 billion be spent over the next five years? That’s the question!