Having their Moon Pies and eating them, too: analyzing public interest in NASA spendingby Alan Steinberg
|

| When looking at two different metrics of spending, it seems that policy funding is both responsive and non-responsive at the same time. |
Using General Social Survey (GSS) data to determine a metric of tolerance of space spending and NASA budgeting from 1973 to 2008, we can attempt to understand the responsiveness of federal space funding policy to public opinion towards space spending. The GSS is an in-person interview by the National Opinion Research Center at the University of Chicago, and has been conducted since 1972. Specifically, the GSS asks the respondent if spending for space exploration is too little, about right, or too much, coded 1, 2, or 3 respectively.
For this analysis tolerance is measured as an annual aggregate of GSS respondent attitudes towards space spending, with the metric initially recoded from –1 to 1, where –1 represents “too much” and 1 represents “too little” to show support for funding. However, as all yearly averages end up between 0 and –1, the metric is revised by adding 1 to demonstrate a tolerance for funding. For example, in 1973, a year with an average of 2.536, representing “too much” is first recoded to –.536, then 1 is added so that the tolerance for funding score is .464.
As annual averages implied an overall opinion towards lowering spending to some degree, a higher value of tolerance implies a willingness to endure increased spending. If public opinion in regards to space exploration funding was driving actual funding, we would expect to see that as tolerance for spending increases there should be a subsequent increase in NASA’s budget.
When NASA’s budget, adjusted for 2007 dollars, is compared with public opinion on spending, a responsive relationship is not apparent. According to the GSS data, tolerance for spending increases from 1976 to 1980, but NASA’s budget does not start increasing until 1982 and continues to do so until 1993. However, the actual funding levels are relatively erratic with two major spikes and corresponding dips found during the course of this eleven-year period. Furthermore, some of the largest drops in funding come in 1988 and 1992, and happen during times when the levels of funding are more tolerant than other times. From 1992 to 1996, tolerance for funding is going up, and from 1996 to 2000 remains relatively stable; meanwhile, NASA’s budget is going down. It is only from 2000 to 2008 that we see trends of tolerance and budget both increasing. When spending is measured as NASA’s budget adjusted for 2007 dollars the correlation between policy and public opinion is positive, but only .333. (Correlation is calculated using the Pearson product-moment correlation or Pearson’s r, whereby the covariance of each of the two metrics divided by the product of their standard deviations.)
When examining the same trends using NASA’s budget as a percentage of the federal budget, the story is quite different. As tolerance for spending rises with the end Apollo program, from 1972 to 1980, NASA’s budget as a percentage of the federal budget continues going down. In fact, NASA’s budget does not start to go up again until 1988, which is likely in response to the presidential influence towards building the International Space Station. Then, from 1991 through today, we see a continuous downward trend in regards to NASA’s budget as a percentage of the federal budget, while tolerance for spending has remained unchanged or has increased over the last fifteen years. When spending is measured as NASA’s budget as a percentage of federal budget, the correlation is strongly negative, –.729. Taking these two findings together, this implies that in years when the public is more tolerant for spending, NASA’s budget goes up in real dollars, but at the same time appears to go down as a percentage of the budget.
| When spending tolerance is higher, there is a greater increase in real dollars and a lesser decrease as a percentage of the budget for NASA. |
Given that creating NASA’s budget is a long-term process, and that it takes time for representatives to be responsive to public opinion, it would be more likely that the public opinion of a given year would not be able to influence the budget for some time. For example, the fiscal year 2011 budget was submitted in February of 2010, so it would seem logical that the public opinion of 2009 that would influence the budget submission. Taking into account this lag time, when spending is measured as the size NASA’s budget (in 2007 dollars) the correlation is positive, .519. This higher result suggests that, when taking the natural budgeting process period into consideration, there is a strong correlation between tolerance for spending and higher spending. Meanwhile, when spending is measured as NASA’s budget as a percentage of federal budget, the correlation is still negative, –.448, but not as strong.
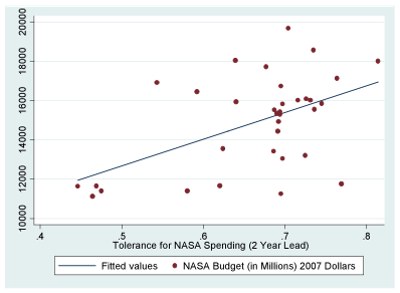 Chart showing NASA spending, in millions of 2007 dollars, versus tolerance for spending with a two-year lag time incorporated. |
Therefore, taking a two-year lag into consideration shows a closer degree of responsiveness for both metrics. When spending tolerance is higher, there is a greater increase in real dollars and a lesser decrease as a percentage of the budget for NASA, as compared to not controlling for response time. The figures show the correlation scatter plots including the lag time for policy responsiveness. The patterns are visually similar, and the fact that the findings are in the same direction as the non-lagged findings provide further support for the duality of policy response.
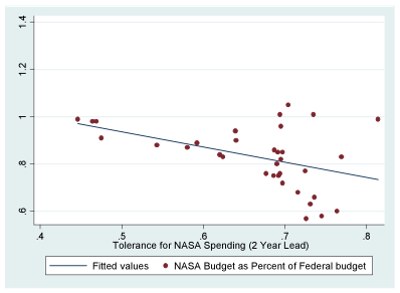 Chart showing NASA spending, as a percentage of the overall federal budget, versus tolerance for spending with a two-year lag time incorporated. |
Taken together, this shows that Congress is catering to both side of the issue. For the overall population, which seems to favor a reduction of spending, the government is reducing funding for NASA as a percentage of the budget. However, the government is also responding to supporters of the space program through increasing funding in real dollars during times when tolerances towards such actions are higher.
Note: This is only a summary snippet from a more detailed analysis originally published as “Space Policy Responsiveness: The Relationship Between Public Opinion And NASA Funding,” in Space Policy 27, no. 4 (November 2011).